Equity Valuation
Balance Sheet and Income Statement
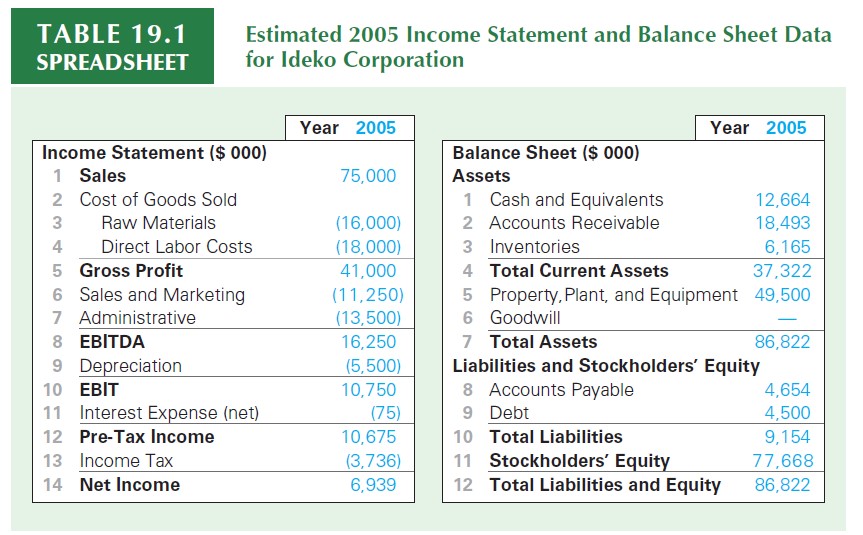
\(\rightarrow\) You can find the hardcoded numbers in the accompaining Microsoft Excel file
Income and Cost Estimates
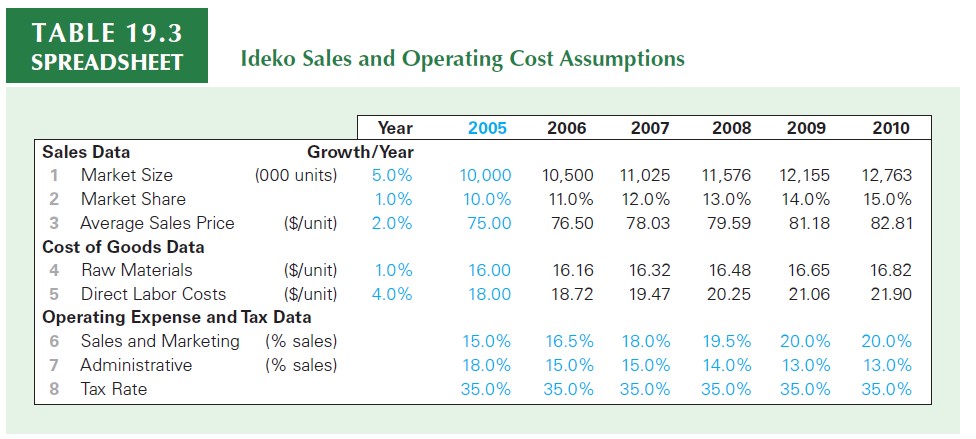
\(\rightarrow\) You can find the hardcoded numbers in the accompaining Microsoft Excel file
- The market is expected to grow by \(\small 5\%\) per year as the company produces a superior product
- KKP plans to cut administrative costs and redirect resources to new product development, sales, and marketing, boosting market share from \(\small 10\%\) to \(\small 15\%\) over the next five years
Capital Expenditures
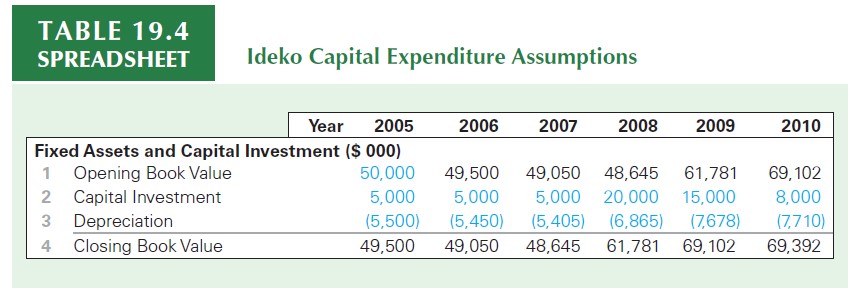
\(\rightarrow\) You can find the hardcoded numbers in the accompaining Microsoft Excel file
The increased sales demand can be met in the short run using the existing production lines by increasing overtime and running some weekend shifts
However, once the growth in volume exceeds \(\small 50\%\), Ideko will definitely need to undertake a major expansion to increase its manufacturing capacity
Working Capital Requirements
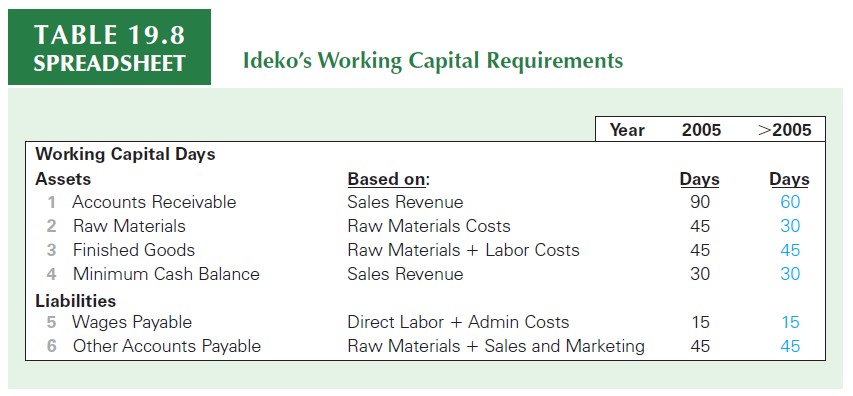
\(\rightarrow\) You can find the hardcoded numbers in the accompaining Microsoft Excel file
Actual Credit Policy: \(\small 90\) days. While standard for the industry is \(\small 60\) days, you believe that Ideko can tighten its credit policy to achieve this goal without sacrificing many sales
While maintaining a certain amount of inventory is necessary to avoid production stoppages, with tighter controls of the production process, \(\small 30\) days’ worth of inventory will be adequate
Planned Debt and Interest Payments
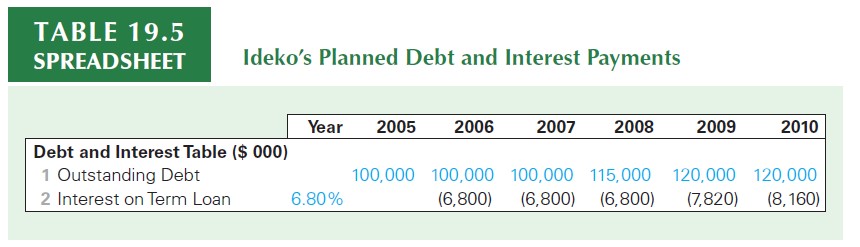
\(\rightarrow\) You can find the hardcoded numbers in the accompaining Microsoft Excel file
You plan to greatly increase the firm’s debt, and have obtained bank commitments for loans of \(\small\$100\) million should an agreement be reached
These term loans will have an interest rate of \(\small 6.8\%\), and Ideko will pay interest only during the next five years
You can compute interest expenses by \(r_d \times D_{t-1}\)
Sources and Uses of Funds
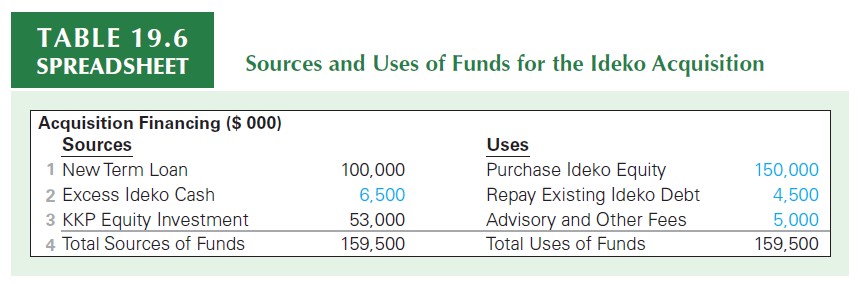
\(\rightarrow\) You can find the hardcoded numbers in the accompaining Microsoft Excel file
- In addition to the \(\small \$150\) million purchase price for Ideko’s equity, \(\small \$4.5\) million will be used to repay Ideko’s existing debt.
- With \(\small \$5\) million in advisory and other fees associated with the transaction, the acquisition will require \(\small \$159.5\) million in total funds
- Required Equity: \(\small 159.5-100-6.5=53,000\)
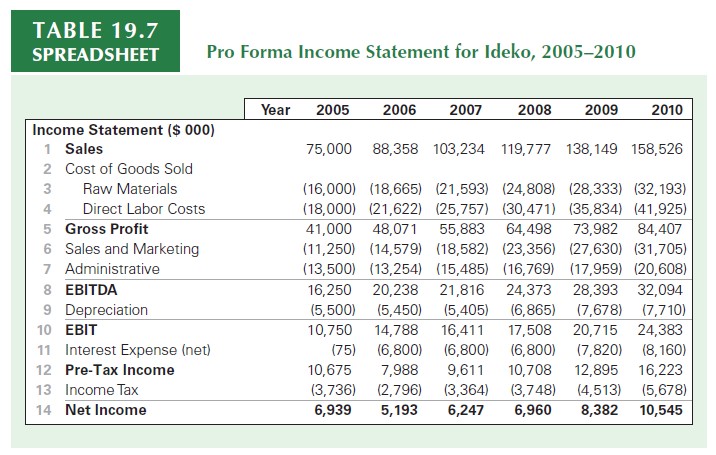
Step 2: The pro-forma income statement
- You can use a similar rationale to project COGS, and use the estimated ratios (in terms of sales) to deduct all other operating costs
- You can plug in interest expenses and taxes based on the assumptions discussed before
- You should be able to have your pro-forma income statement like below:
Step 3: Working Capital Needs
- Using the estimates described before, you should be able to find:
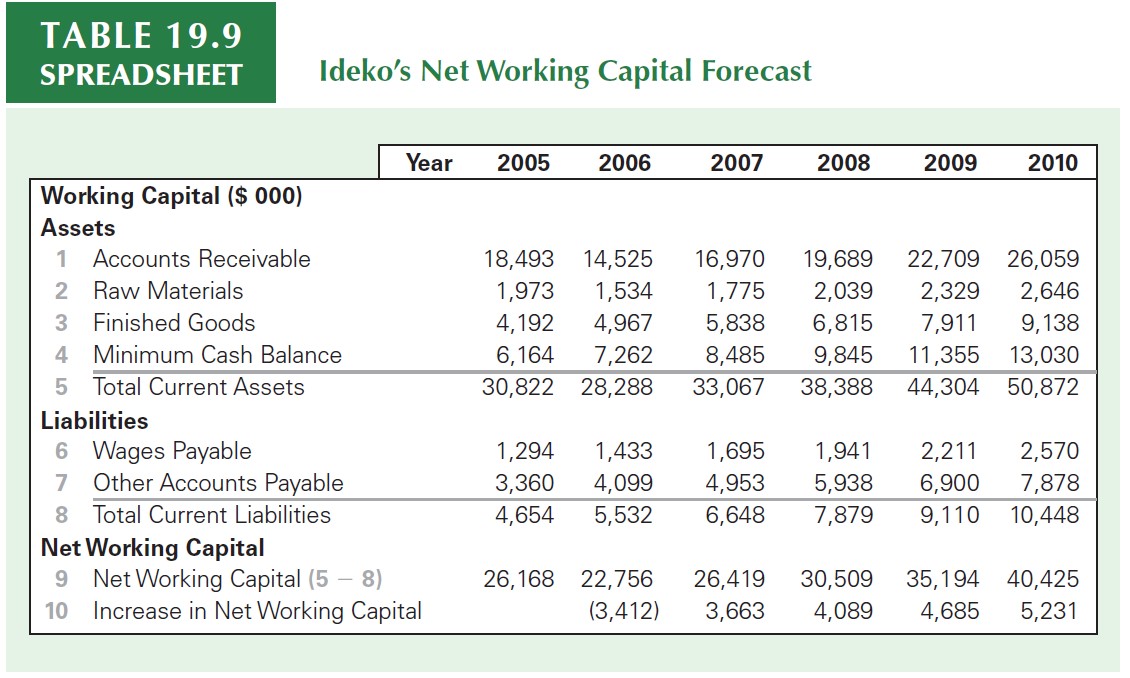
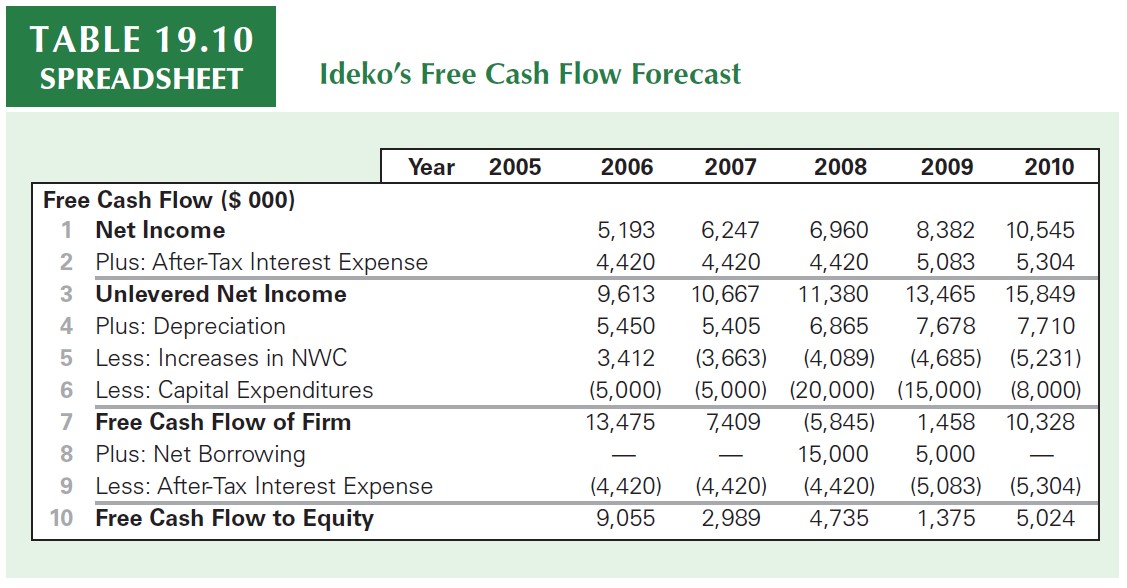
Step 4: Forecasting the Free Cash Flow
References
![]()